Introduction
When it comes to data visualization, the debate of Bokeh vs Plotly is a hot topic. Building a machine learning model necessitates the use of data visualization. To accomplish data visualization, we need a solid library that can aid us in data visualization by boosting interaction while also being visually appealing. There are a lot of data visualization libraries including Matplotlib, Seaborn, Bokeh, Plotly, D3.js, and others. But when it comes to interactivity and diverse plotting possibilities, I found Bokeh and Plotly to be particularly useful. However, it is frequently contested which of these two is superior.
But there is no way of saying which one is superior. Because it depends on the purpose for which you want to use each library. In this article, we’ll compare Bokeh with Plotly and see which one is better for what purpose.
Overview
- Bokeh
- Plotly
- Bokeh vs Plotly
- Conclusion
Bokeh
Bokeh is a data visualization library that is used by many data science professionals. Plots made with Bokeh are flexible, interactive, and shareable. It uses a python environment to display plots and we can code in python language to display the plots and charts. It is totally python centric and deeply integrated with the language. Bokeh also has a host of third-party libraries that extends its use with a high-level user interface.

Let us see an example of a chart using Bokeh. The following code illustrates how to plot using the bokeh library
from bokeh.plotting import figure, output_notebook, show
output_notebook()

x = [0.1, 0.5, 1.0, 1.5, 2.0, 2.5, 3.0]
y = [i**2 for i in x]

fig = figure(
    tools="pan,box_zoom,wheel_zoom,zoom_in,zoom_out,reset,save",
    title="Example Bokeh plot",
    y_axis_type="log",
    y_range=[0.001, 10**3],
    x_axis_label='Sections',
    y_axis_label='Particles (log)',
    plot_width=600, plot_height=400,
)

fig.circle(x, x, legend_label="y=x", fill_color="white", size=8)
fig.line(x, y, legend_label="y=x^2", line_width=3, line_color="red")

show(fig)
the output of the above code looks like below

The above plot is a simple parabolic plot that is plotted with bokeh. It has many interactive components like zoom, pan, search a coordinate, etc., Bokeh offers a lot of interactivity in this way and thus preferred to make dashboards also. Making dashboards with bokeh is a bit lengthy but it can be done and works smoothly.
Advantages of Bokeh
- Bokeh is the ideal tool to build dashboards and charts quickly with interactivity.
- There are various output options for the graphs we plot.
- Bokeh offers an option to embed our visualization in the web pages.
Disadvantages of Bokeh
- The degree of interactivity is limited with this library.
- We develop charts using only one language python.
Plotly
Plotly is an open-source data visualization library that is built on javascript. It is the web’s fastest-growing charting library. It has bindings with several programming languages like Python, Node, R, etc., One can choose a language of their choice to plot the charts. It is compatible with all languages.
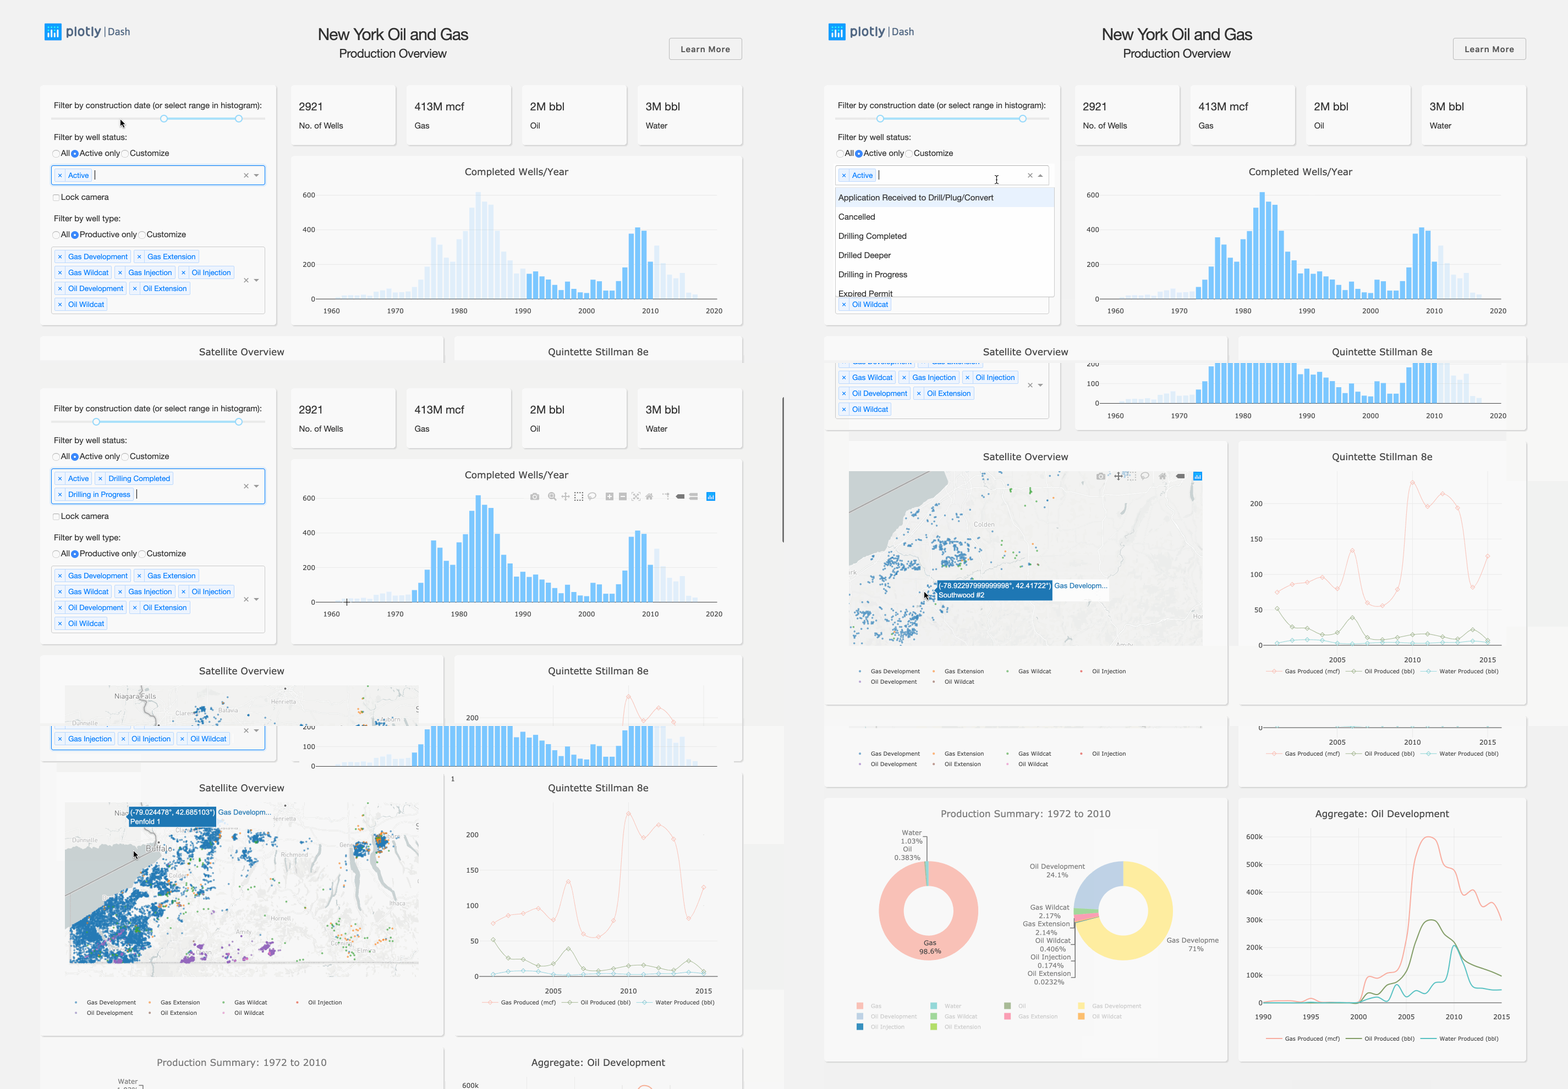
Let us see an example of a chart using Plotly. The following code shows us how to plot using plotly
import plotly.graph_objects as go

x = [0.1, 0.5, 1.0, 1.5, 2.0, 2.5, 3.0]
y = [i**2 for i in x]

fig = go.Figure(
    layout=dict(
        title="Example Plotly plot",
        yaxis_type="log",
        yaxis_range=[-3, 3],
        xaxis_title='sections',
        yaxis_title='particles',
    )
)

fig.add_trace(go.Scatter(x=x, y=x, mode='markers', name="y=x", marker=dict(color='royalblue', size=8)))
fig.add_trace(go.Scatter(x=x, y=y, name="y=x^2", line=dict(width=3)))

fig.show()
The output of the above code looks like below

The above parabolic curve is the same as we plotted with bokeh. Plotly also shows interactivity options like zoom, pan, move, etc., Plotly also offers dashboards services using a special language called dash. Using Plotly dash we can create interactive dashboards and embed them with web applications.
Advantages of Plotly
- We can create interactive javascript plots with this library without knowing any javascript.
- We can share our plots online using multiple platforms.
- It provides compatibility with many programming languages.
- The syntax is very simple and we can embed the interactive plots in webpages.
Disadvantages of Plotly
- The number of color palettes is limited and we can’t make much colors in our visualizations.
- The plots that we share are visible to anyone and we can’t make them private as in bokeh.
Also see: Pytorch vs Tensorflow
Bokeh vs Plotly
So far we saw the basic characteristics of both bokeh and plotly. Both libraries are robust in their own way and work very differently and provide different experiences. But we can’t use two libraries at the same time and it’s wise to plot our all plots and make dashboards with one library for uniformity. But choosing between the two becomes difficult. So let’s do a Bokeh vs Plotly comparison for different parameters to see which one is better for our plotting
| Parameter | Bokeh | Plotly |
| Dashboards | Bokeh serves dashboards using bokeh server | Plotly serves dashboard using the dash |
| Plot features | Plotting in Bokeh is a bit intense and has no 3D graphing | Plotly code is simple and has 3D graph features |
| Ease of learning and use | Styling graphs with bokeh is a tedious process | Plotly makes styling graphs easy |
| Data handling | Bokeh handles data well and is fast | Plotly handles data as data frames and takes time to plot |
| Dashboard Interactions | Dashboards with Bokeh server are dynamic and very fast | Plotly dash is a bit static and takes time to load, hence it is very slow |
Conclusion
We have seen a very comprehensive comparison of Bokeh vs Plotly and also we discussed the advantages and disadvantages of each library. In this comparison of Bokeh vs Plotly, we can’t make out a decisive choice between the two. Though Plotly is good for plotting graphs and visualizing data for insights, it is not good for making dashboards. To make dashboards we can use bokeh and can have very fast dashboards and interactivity. In this comparison of Bokeh vs Plotly, there is no clear winner. We have to choose a library based on our purpose. Also, comment your thoughts regarding these two libraries, and feel free to ask doubts in the comment section.
Also see: Matplotlib cheat sheet

Data Scientist with 3+ years of experience in building data-intensive applications in diverse industries. Proficient in predictive modeling, computer vision, natural language processing, data visualization etc. Aside from being a data scientist, I am also a blogger and photographer.
- Aman Kumarhttps://buggyprogrammer.com/author/buggy5454/
- Aman Kumarhttps://buggyprogrammer.com/author/buggy5454/
- Aman Kumarhttps://buggyprogrammer.com/author/buggy5454/
- Aman Kumarhttps://buggyprogrammer.com/author/buggy5454/


