Introduction
When I am using group by(),pivot_table() to analyze the data and do data manipulation methods like a heat map, pandas introduce me to a brand-new function called crosstab(). The crosstab function is used to calculate the cross-tabulation, which helps me to understand the relationship between variables easily. In this article, we discuss how to use crosstab() and why you should use it instead of other similar functions. They are widely used in polling, business intelligence, engineering, and scientific research. It provides a basic picture of the relationship between two variables and can aid in the discovery of inter-relationship between them.
In Data Analysis, Pandas has many functions to analyze the data, group the data, and Summarize it. A crosstab (also called a contingency table or cross-tabulation) is a table that displays the frequency distribution of one variable in rows and another in columns.
OverView
- Pandas Crosstab Parameters
- Pandas Crosstab Basics
- Pandas Crosstab with aggregation functions
- Pandas Crosstab Vs Pivot table Vs Groupby functions
- Pandas Crosstab using plot
- Conclusion
Pandas Crosstab Parameters
Pandas Crosstab syntax is,
pandas.crosstab(index, columns, values=None, rownames=None, colnames=None, aggfunc=None, margins=False, margins_name='All', dropna=True, normalize=False)
The table represents the parameters in the crosstab function:
| Name | Description | Type |
| Index | Values to group by in rows | Array/List/Series |
| Columns | Values to group by in columns | Array/Series |
| Values | The array of Values to aggregate based on factors. | Array |
| rownames | If passed, the number of row arrays must match. | Sequential |
| colnames | If passed, the number of columns arrays must match. | Sequential |
| aggfunc | If specified, values must also be specified. | Function |
| margins | Include row/column margins (subtotals). | Bool |
| margins_name | When margins are True, the name of the row/column that will contain the totals is used. | Str |
| dropna | Columns with all NaN values should not be included. | Boolean |
| normalize | Normalize by dividing all values by their sum. | bool, {‘all’, ‘index’, ‘columns’}, or {0,1} |
Pandas CrossTab Basics
Learning the Pandas Crosstab method by implementing it on Credit Card Customer Dataset
import pandas as pd
df = pd.read_csv(r"./BUGGY_PROGRAMMER/DATASET/BankChurners.csv")
df.head()

crosstab() always returns a data frame, as shown below. The data frame is a cross-tabulation of two variables: Education_level and Gender. Cross tabulation simply means displaying one variable’s groups as indexes and the other variable’s groups as columns.
Implementation of Crosstab function using Python
crosstab_table = pd.crosstab(df['Education_Level'],df['Gender'])
print(crostab_table)

Here, We are implementing crosstab function to get relationship pattern between Income_Category and Gender Variables
"""Implementing Crosstab function using Python"""
crosstab_table2 =pd.crosstab(df['Income_Category'],df['Gender'])
print(crosstab_table2)

table3 = pd.crosstab(df['Gender'],df['Income_Category'])
print(table3)

Pandas Crosstab function Sum
Here sum function is used to add values of crosstab
sum_of_crosstab = pd.crosstab(df['Gender'],df['Income_Category']).sum()
print(sum_of_crosstab)

Pandas Cross tab Normalize
- If ‘all’ or True is specified, the overall data will be normalized.
- If ‘index’ is given, it will normalize each row.
- If ‘columns’ are supplied, it will normalize each column.
- If margins are set to True, the margin values will be normalized as well.
Implementing Normalize using Python
"""Normalizing the overall data values"""
normalize_all = pd.crosstab(df['Gender'],df['Income_Category'],normalize='all')
print(normalize_all)
Here, We are normalizing the overall data values(rows and columns) of two variables Income_Category and Gender with percentages

"""Normalizing the row / index values"""
normalize_row = pd.crosstab(df['Gender'],df['Income_Category'],normalize='index')
print(normalize_row)

"""Normalizing the columns values"""
normalize_columns = pd.crosstab(df['Gender'],df['Income_Category'],normalize='columns')
print(normalize_columns)

normalize_true = pd.crosstab(df['Gender'],df['Income_Category'],normalize=True)
print(normalize_true)

custom_pd.crosstab(index=df['Card_Category'],
            columns=df['Attrition_Flag'],
            margins=True,
            margins_name='Total Percentage',
            normalize=True)

Pandas Crosstab Count
Pandas Crosstab function we can perform count operation as shown below, where the count is the total number of times a specific thing. To perform count we have the set margin to be True and margin_name is to be all, which default one, or else we can change the column name to be like Total_count.
crosstab_count = pd.crosstab(index =
                                               df['Gender'],columns=df['Income_Category'],margins=True,margins_name="Total_count")
print(crosstab_Count)

Pandas Crosstab Multiple
Multiple_indexes = pd.crosstab(index =[df['Gender'],df['Card_Category']],columns =df['Income_Category'])
print(Multiple_indexes)

Pandas Crosstab Multiple Columns
multi_col = pd.crosstab(index =df['Gender'],columns =[df['Income_Category'],df['Card_Category']])
print(multi_col)

Pandas Crosstab with aggregation function
import numpy as np
pd.crosstab(
    df.Card_Category,
    df.Attrition_Flag,
    values=df.Months_on_book,
    aggfunc=np.mean
)

pd.crosstab(
    df.Card_Category,
    df.Attrition_Flag,
    values=df.Months_on_book,
    aggfunc=np.median,
    margins_name ="Median",margins = True
)

Pandas Crosstab Vs Pivot table Vs Groupby functions
We compare the differences between the three functions of crosstab(),pivot_table(), and groupby() in syntax and return of their results.
Group by Function in Pandas
df.groupby(['Card_Category', 'Attrition_Flag'])['Months_on_book']\
                                           .agg([np.mean]).reset_index()

Pivot_table Function in Pandas
df.pivot_table(values='Months_on_book',
                     index='Card_Category',
                     columns='Attrition_Flag',
                     aggfunc=np.mean)

The pivot table expects your input data to already be a DataFrame, while you pass a data frame to the pivot table and specify the index, columns, and values bypassing the column names as strings. You don’t need to pass a dataFrame into crosstab because you just pass array-like objects for index, columns, and values. Crosstab has the normalized parameter to perform percentage by dividing all values by their sum where pivot table doesn’t have.
| groupby() | pivot_table() | crosstab() |
| Input data should be in Dataframe | Input data should be in Dataframe | You can pass array-like objects |
| Passing Columns name in String format | Passing Columns in string format | No need to pass in string format |
Pandas Crosstab using plot
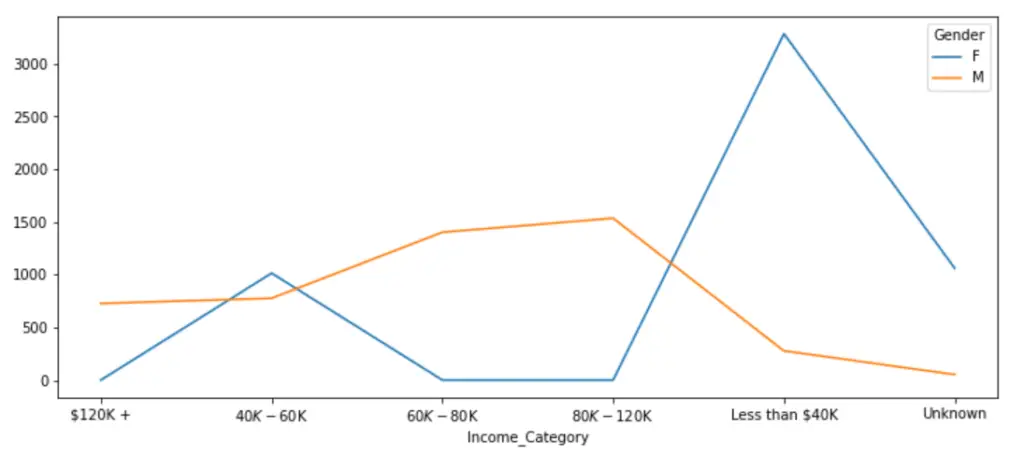
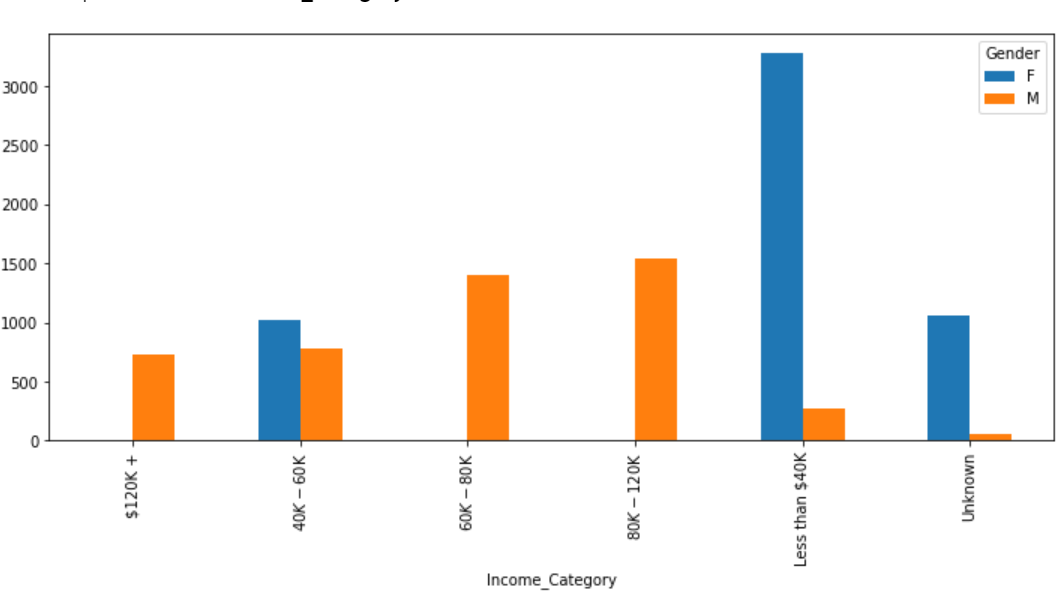
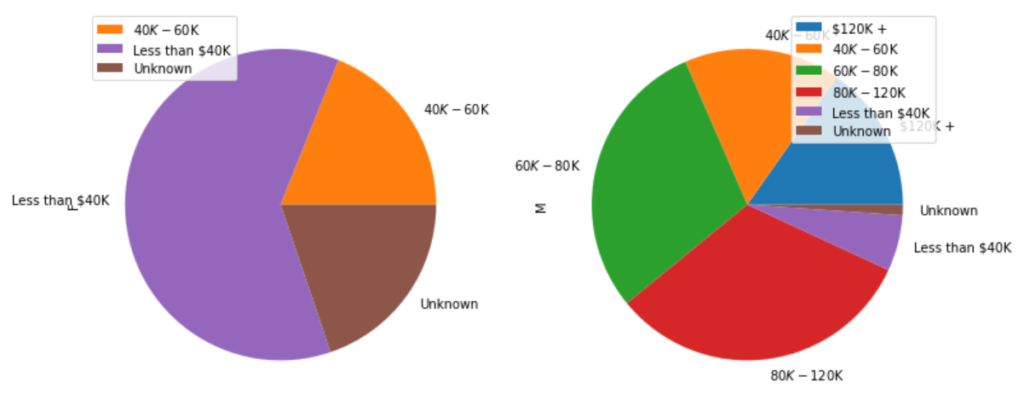
How to prepare plots for crosstab function in pandas as shown below
Implementing the line, bar, pie charts, and heat map using python
pd.crosstab(df['Income_Category'],df['Gender']).plot(kind='line',figsize=(12,5))
pd.crosstab(df['Income_Category'],df['Gender']).plot(kind='bar',figsize=(12,5))
pd.crosstab(df['Income_Category'],df['Gender']).plot(kind='pie',subplots =True,figsize=(12,12))
import seaborn as sns
cross_tab = pd.crosstab(
    df.Card_Category,
    df.Attrition_Flag,
    values=df.Months_on_book,
    aggfunc=np.mean
)
sns.heatmap(cross_tab, cmap='rocket_r', annot=True, fmt='g')

Also, read more about Data Visualization – Bokeh Vs Plotly
Conclusion
In this article, We understand the crosstab function utilization by implementing with credit card customer dataset, and with help of parameters in the function, we can count the values, normalize them with percentages and we perform different types of aggregate functions like mean, median e.t.c., how to plot the different types of the plots for crosstab to have better analysis compared to pivot table and group by functions in pandas. Feel free to ask questions or comment your thoughts on the topic, if any need math and details further.
Thanks for reading the article.

Data Scientist with 3+ years of experience in building data-intensive applications in diverse industries. Proficient in predictive modeling, computer vision, natural language processing, data visualization etc. Aside from being a data scientist, I am also a blogger and photographer.
- Aman Kumarhttps://buggyprogrammer.com/author/buggy5454/
- Aman Kumarhttps://buggyprogrammer.com/author/buggy5454/
- Aman Kumarhttps://buggyprogrammer.com/author/buggy5454/
- Aman Kumarhttps://buggyprogrammer.com/author/buggy5454/

