If you have prepared an ML algorithm, you have definitely compared the Confusion matrix positivity rate vs F1 score. The one most subtle way of analyzing your model’s performance can be by using what is known as the Confusion or Error matrix. The values of the Confusion matrix help any data scientist decide if their model fits the data well or not nearly well (underfit) or too well (overfit).
In this article, we’ll study the differences between Confusion Matrix positivity rate vs f1 score and what they mean, and how to calculate them.
What are Confusion Matrices?
When calculating the performance of a machine learning model nowadays, everyone focuses on trying to improve the accuracy and precision of the model which are of course, really important metrics but by diving deeper into their metrics and understanding what the additional metrics of a Confusion matrix mean, data scientists can derive more meaning out of their data than ever before. The confusion matrix positivity rate vs f1 score are just two out of the many uses of a Confusion matrix.
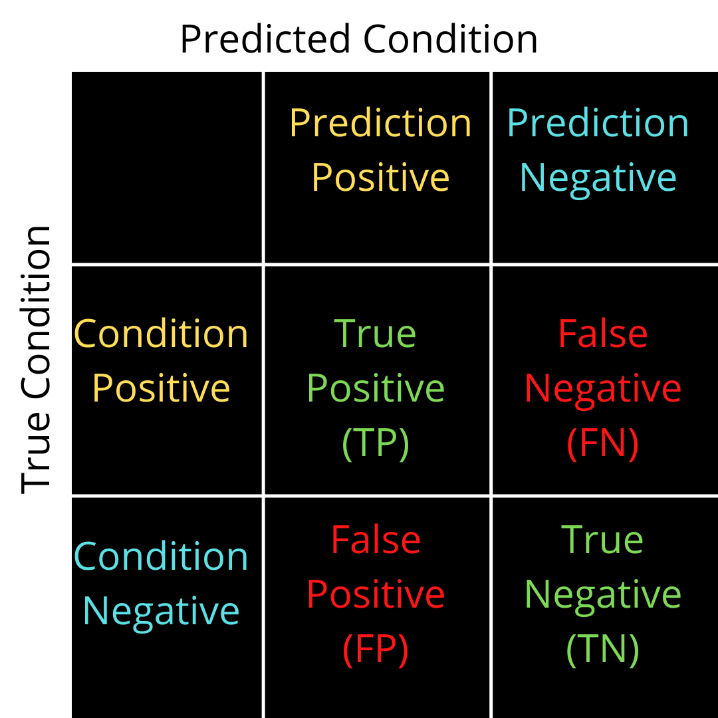
The name comes from the fact that there is confusion on the values predicted or true values and thereby causing errors. There are generally 4 types of values in the confusion matrix comprising of two classes. Class one deals with condition positive where the value can be a True positive or a False positive. Class two deals with the condition of negative values where the value can be a True Negative or a False Negative.
Confusion matrices can help individuals ascertain multiple metrics for their data namely;
- Sensitivity or True Positive Rate
- Specificity
- Precision and Recall
- Likelihood Ratios
- F1 Score
Understanding the difference between Confusion matrix positivity rate vs f1 score helps individuals communicate better insights from their predictions whilst making sure that their model fits the data well.
If you are new to Confusion matrices, Find more about them here -> Confusion Matrix
This unique contingency table has two dimensions (“actual” and “predicted”), and identical sets of “classes” in both dimensions.
How to create a confusion matrix in Python?
Creating a confusion matrix using Python is relatively easy thanks to the metrics class code from Scikit learn where one can create a confusion matrix using the code as given below with example data for demonstration:
from sklearn.metrics import confusion_matrix
y_true = [2, 0, 2, 2, 0, 1] #Example
y_pred = [0, 0, 2, 2, 0, 2] #Example
confusion_matrix(y_true, y_pred)
Confusion Matrix Positivity Rate vs F1 Score explained

True Positive Rate – If for example, in a covid test prediction, the patient is predicted to have covid 19 based on the test conducted and the diagnosis is true i.e., the patient is actually having covid 19, the test and the true value are both the same. The predicted value, as well as the actual value, are positive, i.e., the model correctly predicts the class label to be positive. The ratio of true positive and totally positive, i.e.,
TPR = TP / P
TPR = TP / (FN+TP)
Precision and recall
Two more positivity ratios are Precision and Recall which work as follows;
Precision: Of all the given points that the model has predicted to be positive, what is the true percentage of the positive points?
Precision = TP / (FP+TP)
Recall: Of all the given actually positive points what percentage of them are predicted positive points?
Recall = TP / (FN+TP)
These positivity rates are important because they help the data scientist understand whether the data is accurate enough to be put into production.
Consider someone who has Covid 19 and was wrongly predicted to not have it. That is termed a Type II error in a confusion matrix or a False Negative, which can prove to be deadly in the long run. In this case, it’s important for a data scientist to calculate the required metrics and positivity rates to understand if it is necessary to conduct a re-test or change the model to adapt to the information given to the model. This is provided if the model exhibits balanced data and is not biased towards one type of data.
But when your data is biased or imbalanced, that’s where the F1 Score comes into the picture. You will clearly see next how for an imbalanced dataset the choice between Confusion matrix positivity rate vs f1 score is easily answered.
F1 Score
It is a very well-known problem with accuracy, that is when you have imbalanced datasets. Say, 75% of X’s activities were friendly. Then, a model that predicts friendly for all activities will get an accuracy of 75%. This not-so-good classifier gets a seemingly very good quality score.
Now for this problem, a solution is that you look for recall and precision instead of Accuracy. In our example, let’s say that ‘friendly’ is a positive class. Then, always predicting friendly results is an optimal recall of 100%. Always predicting not friendly results in 0% recall.
The counterpart to recall is precision. Predicting almost all cases as not friendly will let you reach a precision of 100% on the other hand. All you need to get a perfect precision is to predict the positive class for one case where you are absolutely sure.
This brings the F1 score, which depends heavily on how imbalanced our training dataset is, to our rescue. The idea with the F1 Score is to provide a single metric that weights the two ratios (precision and recall) in a balanced way, requiring both to have a higher value for the F1-score value to rise, as the F1 score is simply the harmonic mean between Precision and Recall.
Notably, using the F1 score leads to a lower overall score for very small precision or recall and it helps balance the two metrics. If you choose your positive class as the one with fewer samples, the F1 score can help balance the metric across the given positive/negative samples. How to find an F1 Score in Python?
Using the metrics class code from the Scikit Learn library, one can calculate the F1 Score easily with a one-liner code as demonstrated below:
from sklearn.metrics import f1_score
y_true = [0, 1, 2, 0, 1, 2]
y_pred = [0, 2, 1, 0, 0, 1]
f1_score(y_true, y_pred, average=None)
Find more about the F1 Score in Scikit learn here: Scikit Learn F1 Score documentation
Conclusion
Should your data have an imbalanced structure, it is then imperative for you to use an F1 score to ensure your model is not overfitting or underfitting the data and is performing perfectly right for it to be brought to the production level. The F1 score is a good metric to include in your analysis which can be put forward in the report with metrics like accuracy and precision to show your model’s performance.
The confusion matrix positivity rate vs f1 score is not a difference to really exploit but to understand why both these ratios are important in your model’s performance measurement. But like always ensure you are taking the right amount of Domain knowledge into consideration before you get to a choice between the two. Try finding the F1 Score for your dataset in the models you’ve already created and see if it performs equally well on accuracy and precision.
For more such content, check out our website -> Buggy Programmer

An eternal learner, I believe Data is the panacea to the world's problems. I enjoy Data Science and all things related to data. Let's unravel this mystery about what Data Science really is, together. With over 33 certifications, I enjoy writing about Data Science to make it simpler for everyone to understand. Happy reading and do connect with me on my LinkedIn to know more!